Economy of Mauritania
 | |
| Currency | Ouguiya (MRU, UM) |
|---|---|
| Calendar Year | |
Trade organisations | AU, AfCFTA, AfDB, CEN-SAD, WTO, Group of 77 |
| Statistics | |
| GDP | |
GDP growth |
|
GDP per capita | |
GDP by sector | agriculture (14.9%) industry (48.0%) services (37.1%) (2012 est.) |
| 3.053% (2018 est.)[1] | |
Population below poverty line | 40% (2004 est.) |
| 39 (2000) | |
Labour force | 1.318 million (2007) |
Labour force by occupation | agriculture (50.0%) industry (2%) services (48%) (2001 est.) |
| Unemployment | 30% (2008 est.) |
Main industries | mining (iron ore, gold, copper, gypsum), petroleum, fish processing |
| External | |
| Exports | |
Export goods | iron ore, petroleum, gold, copper, gypsum, fish |
Main export partners | |
| Imports | |
Import goods | machinery, petroleum products, food |
Main import partners | |
Gross external debt | |
| Public finances | |
| Revenues | $1.143 billion (2012 est.) |
| Expenses | $1.263 billion (2012 est.) |
All values, unless otherwise stated, are in US dollars. | |

The economy of Mauritania is still largely based on agriculture, slave labour and livestock, even though most of the nomads and many subsistence farmers were forced into the cities by recurring droughts in the 1970s and 1980s.

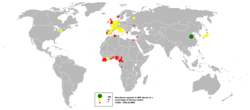
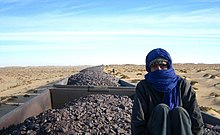
Mauritania has extensive deposits of iron ore, which account for almost 50% of total exports. The decline in world demand for this ore, however, has led to cutbacks in production. With the current rise in metal prices, gold and copper mining companies are opening mines in the interior.
The nation's coastal waters are among the richest fishing areas in the world, but overexploitation by foreigners threatens this key source of revenue. The country's first deep water port opened near Nouakchott in 1986.
In recent years, drought and economic mismanagement have resulted in a buildup of foreign debt. In March 1999, the government signed an agreement with a joint World Bank-International Monetary Fund mission on a $54 million enhanced structural adjustment facility (ESAF). The economic objectives have been set for 1999–2002. Privatization remains one of the key issues.
Macro-economic trends
[edit]This is a chart of trend of gross domestic product of Mauritania at market prices estimated by the International Monetary Fund with figures in millions of Mauritanian Ouguiyas.
| Year | Gross Domestic Product | US Dollar Exchange | Inflation Index (2000=100) |
|---|---|---|---|
| 1980 | 37,211 | 45.93 Ouguiyas | 23 |
| 1985 | 60,197 | 77.07 Ouguiyas | 36 |
| 1990 | 97,819 | 80.64 Ouguiyas | 52 |
| 1995 | 158,443 | 129.76 Ouguiyas | 73 |
| 2000 | 258,245 | 240.00 Ouguiyas | 100 |
| 2005 | 514,642 | 265.55 Ouguiyas | 144 |
Current GDP per capita of Mauritania grew 82% in the Sixties reaching a peak growth of 166% in the Seventies. But this proved unsustainable, and growth consequently scaled back to 14% in the Eighties. Finally, it shrank by 29% in the Nineties. Mean wages were $0.97 per man-hour in 2009.
The following table shows the main economic indicators in 1990–2017.[7]
| Year | GDP
(in bil. US$ PPP) |
GDP per capita
(in US$ PPP) |
GDP
(in bil. US$ nominal) |
GDP growth (real) |
Inflation (in Percent) |
Government debt (Percentage of GDP) |
|---|---|---|---|---|---|---|
| 1990 | 3.75 | 1,880 | 1.79 | ... | ... | ... |
| 1995 | 4.86 | 2,118 | 2.09 | 9.8% | 6.5% | ... |
| 2000 | 5.91 | 2,235 | 1.78 | −0.4% | 3.3% | 234% |
| 2005 | 8.32 | 2,731 | 2.94 | 9.0% | 12.1% | 155% |
| 2006 | 10.20 | 3,453 | 4.01 | 18.9% | 6.2% | 83% |
| 2007 | 10.76 | 3,545 | 4.33 | 2.8% | 7.2% | 73% |
| 2008 | 11.09 | 3,556 | 5.14 | 1.1% | 7.5% | 78% |
| 2009 | 11.06 | 3,454 | 4.73 | −1.0% | 2.2% | 90% |
| 2010 | 11.73 | 3,571 | 5.64 | 4.8% | 6.3% | 81% |
| 2011 | 12.53 | 3,720 | 6.78 | 4.7% | 5.7% | 72% |
| 2012 | 13.51 | 3,911 | 6.72 | 5.8% | 4.9% | 74% |
| 2013 | 14.56 | 4,116 | 7.33 | 6.1% | 4.1% | 71% |
| 2014 | 15.64 | 4,321 | 6.62 | 5.6% | 3.8% | 80% |
| 2015 | 15.95 | 4,304 | 6.18 | 0.8% | 0.5% | 98% |
| 2016 | 16.42 | 4,328 | 6.41 | 1.6% | 1.5% | 99% |
| 2017 | 17.25 | 4,444 | 6.83 | 3.2% | 2.3% | 91% |
Diversification
[edit]In 2007, mining industries accounted for well over 35 percent of the Mauritanian economy, with the fish industry so much as 54% (with big changes between these industries in the power relationship).[8] Diversification of the economy into non-mining industries remains a long-term issue. Mauritania is a net importer of food, reportedly importing 70% of its domestic food needs.[9]
Natural Gas and the Tortue/Ahmeyim Project
[edit]In 2015, Kosmos Energy made significant natural gas discoveries on the maritime border between Senegal and Mauritania, and in December 2016, it entered into partnership with British Petroleum.[10] The two companies, along with Mauritanian and Senegalese governments and the two countries' national oil companies, are optimistic about the potential of these gas discoveries. The Grand Tortue/Ahmeyim reserves are estimated at 15 trillion cubic feet.[11] According to BP, 'that's equivalent to all of Africa's current gas production for nearly seven years.' [11] The production phase will begin in 2022, starting with 2.3 million tons annually.[12]
Dispute with Woodside Petroleum
[edit]In February 2006, the new Mauritanian government denounced amendments to an oil contract made by former Leader Ould Taya with Woodside Petroleum, an Australian company. In 2004, Woodside had agreed to invest US$600 million in developing Mauritania's Chinguetti offshore oil project. The controversial amendments, which Mauritanian authorities declared had been signed "outside the legal framework of normal practice, to the great detriment of our country", could cost Mauritania up to $200 million a year, according to BBC News. Signed by Woodside two weeks after the February 1, 2005, legislation authorizing the four amendments, they provided for a lower state quota in the profit-oil, and reduced taxes by 15 percent in certain zones. They also eased environmental constraints and extended the length and scope of the exploitation and exploration monopoly, among other measures.
The disputed amendments were signed by former Oil Minister Zeidane Ould Hmeida in February 2004 and March 2005. Hmeida was arrested in January 2006 on charges of "serious crimes against the country's essential economic interests".
Nouakchott's authorities declared that the government would likely seek international arbitration, which Woodside (which operated for Hardman, BG Group, Premier Oil, ROC Oil, Fusion, Petronas, Dana Petroleum, Energy Africa and the Hydrocarbons Mauritanian Society) also contemplated.
Discovered in 2001, Chinguetti has proven reserves of about 120,000,000 barrels (19,000,000 m3) of oil. At the end of December 2005, authorities estimated that in 2006, the oil profits would be 47 billion ouguiyas (about US$180 million) and represent a quarter of the state budget, according to RFI.[13]
Some U.S. oil companies are alleged to be playing a part in Mauritania's oil related corruption.[14]
Electricity
[edit]Mauritania has 380 MW of generating capacity, of which 263 MW are fossil fuels and 117 MW are renewable.[15] Its sunny weather makes solar power highly favorable, and eight plants totaling 16.6 MW were installed with the support of Masdar in 2016.[16]
See also
[edit]- List of companies based in Mauritania
- United Nations Economic Commission for: Africa & Western Asia
https://en.wikipedia.org/wiki/Slavery_in_Mauritania
References
[edit]- ^ a b c d e "World Economic Outlook Database, April 2023". IMF.org. International Monetary Fund. Retrieved 23 April 2023.
- ^ "Global Economic Prospects, June 2019: Heightened Tensions, Subdued Investment. p. 127" (PDF). openknowledge.worldbank.org. World Bank. Retrieved 15 November 2019.
- ^ "Human Development Index (HDI)". hdr.undp.org. HDRO (Human Development Report Office) United Nations Development Programme. Retrieved 9 September 2022.
- ^ "Inequality-adjusted Human Development Index (IHDI)". hdr.undp.org. HDRO (Human Development Report Office) United Nations Development Programme. Retrieved 11 December 2019.
- ^ "Mauritania trade balance, exports and imports by country 2022". OEC. 2021. Retrieved 2021-10-25.
- ^ "Mauritania trade balance, exports and imports by country 2021". OEC. 2021. Retrieved 2022-10-25.
- ^ "Report for Selected Countries and Subjects". Retrieved 2018-09-09.
- ^ International Trade Company
- ^ IRIN 2008, 'MAURITANIA: Record hunger predicted in 2008', www.irinnews.org, 19 March. Retrieved on 20 March 2008.
- ^ "Future potential: how Mauritania and Senegal are set to become new players in natural gas supply". bp.com. 8 May 2017.
- ^ a b "The Tortue/Ahmeyim projectThe Tortue/Ahmeyim project". bp.com. Retrieved 2019-10-03.
- ^ "IMF Islamic Republic of Mauritania : Third Review Under the Extended Credit Facility Arrangement-Press Release; Staff Report; and Statement by the Executive Director for the Islamic Republic of Mauritania". imf.org. 31 May 2019.
- ^ "Mauritania and firm row over oil". BBC News. 2006-02-06."Crise ouverte avec la compagnie pétrolière Woodside". Radio France International. 2006-02-06. Archived from the original on 2021-01-26. Retrieved 2008-03-10.
- ^ Looking Glass News. "Mauritanian coup has Bush administration[sic]/Big Oil fingerprints". Looking Glass News. Retrieved 2010-03-29.
- ^ "Power Africa in Mauritania | Power Africa | U.S. Agency for International Development". www.usaid.gov. 2019-10-21. Retrieved 2020-02-28.
- ^ "UAE installs eight solar energy plants in Mauritania". The National. 27 November 2016. Retrieved 2020-02-28.
![]() This article incorporates public domain material from The World Factbook. CIA.
This article incorporates public domain material from The World Factbook. CIA.
External links
[edit]- Mauritania latest trade data on ITC Trade Map
- Katsarova, Ivana. "EU-Mauritania fisheries agreements" (PDF). Library Briefing. Library of the European Parliament. Retrieved 17 June 2013.
